BY: MARK NOBLE, SENIOR VICE-PRESIDENT, ETF STRATEGY, HORIZONS ETFS
October 31, 2017
Year-to-date, the Horizons Cdn Insider Index ETF (HII) has generated an impressive total return of 10.55%, outperforming the broad Canadian equity markets (as represented by the S&P/TSX Composite Index), which returned only 7.30% year-to-date.
As we potentially enter into an extended Canadian equity rally, HII may offer an opportunity to capture more upside without taking on excessive levels of risks.
HII uses a value-momentum factor approach, similar to a typical CPMS portfolio. The interesting part about this ETF is that it uses insider commitment to validate these rankings and then proceeds to equal-weight the constituents.
This methodology includes several components that we see as advantageous for investors, as it:
1. Seeks to uncover attractive stocks often overlooked – by focusing on the insider opportunity instead of size, HII is able to pick up on attractive holdings that could easily be overlooked by other models.
2. Is designed to avoid concentration in a few large holdings – having an equal-weighting methodology gives the ETF more mid-cap bias, with less exposure to big banks than its market-weighted index counterparts (as represented by the S&P/TSX Composite Index).
3. Provides a second layer of defense – by using insider trading as a validation/signal, you get more reassurance than simply buying because it has been going up.
Below are some examples illustrating each of the above advantages using HII data over the past few months.
=====================
1. HII Uncovers Attractive Stocks Often Overlooked
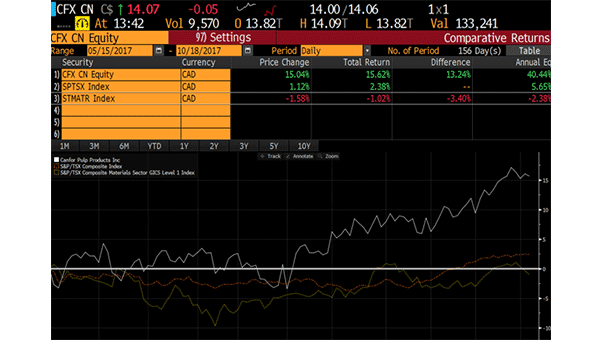
Take the pulp company “Canfor Pulp Products”, for example. This company has seen 15% gains since the last rebalance in May of 2017.
Being a sub-$1 billion company, it is highly unlikely that this stock would be captured by most value momentum strategies. HII picked this stock up back in May because it has strong value and momentum factors. More importantly, the stock had insider purchases validating the decision (see below).

Source: Bloomberg, as at October 18, 2017.

Source: Bloomberg, from May 15, 2017 to October 18, 2017.
2. Less exposure to big banks
The energy/materials sector was perhaps the most impactful sector contributing to the gains seen in HII. Under traditional market cap weighting, financial stocks would have contributed to a performance drag. To give you a perspective of how impactful this performance drag is, below are some new additions from the May rebalance. Notice how well they performed against the sector benchmark.

Source: Bloomberg, from December 30, 2016 to October 17, 2017.
3. A second layer of defense
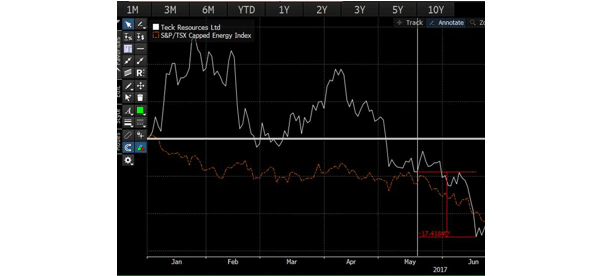
Back in May, Teck Resources (a holding) saw its value and momentum factors deteriorating. Supported by the lack of insider purchases of this stock, Teck Resources was dropped following the rebalance on May 19th. The stock then proceeded to drop by 17%.

Source: Bloomberg, as at October 17, 2017.
These three components offer great potential for HII, and we may see its success continue in the coming weeks!
Annualized Performance *
| 1-mo | 3-mo | 6-mo | YTD | 1-year | 3-year | 5-year | 10-year | 15-year | Since Inception | Inception Date | |
| Horizons Cdn Insider Index ETF |
4.38% | 9.13% | 7.68% | 10.55% | 14.29% | – | – | – | – | 10.85% | 20/01/2015 |
| S&P/TSX Composite Index (TR) |
2.73% | 6.58% | 4.31% | 7.30% | 11.48% | 6.22% | 8.41% | 3.94% | 9.34% | 10.20% | 03/01/1977 |
*Source: Morningstar, as at October 31, 2017.
The indicated rates of return are the historical annual compounded total returns including changes in per unit value and reinvestment of all dividends or distributions and do not take into account sales, redemption, distribution or optional charges or income taxes payable by any securityholder that would have reduced returns. The rates of return shown in the table are not intended to reflect future values of the ETF or returns on investment in the ETF. Only the returns for periods of one year or greater are annualized returns.
The views/opinions expressed herein may not necessarily be the views of Horizons ETFs Management (Canada) Inc. All comments, opinions and views expressed are of a general nature and should not be considered as advice to purchase or to sell mentioned securities. Before making any investment decision, please consult your investment advisor or advisors.

